The content of this page has not been vetted since shifting away from MediaWiki. If you’d like to help, check out the how to help guide!
Spatial Pathology Plugin
Usage
This is a gastrointestinal-focused spatial pathology plugin to advance research in spatial analysis of GI epithelial tissues to quantify immunostaining markers in a tissue landscape through a spatial lens.
Installing
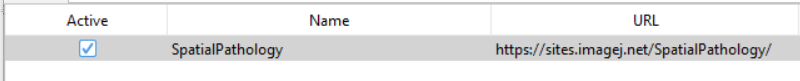
In order to use this plugin, you need Fiji which is the latest version of ImageJ, you must use this version in order to get the remote update. This plugin is hosted on a remote webserver so you can download it using this tutorial: https://imagej.net/update-sites/following and by using the URL http://sites.imagej.net/SpatialPathology/ You only need to do this on the first install, if it was installed correctly you will see “SpatialpathologyIJMJava” in your plugins folder and if any changes are made to the plugin, all you will need to do is update your imagej.
Workflow
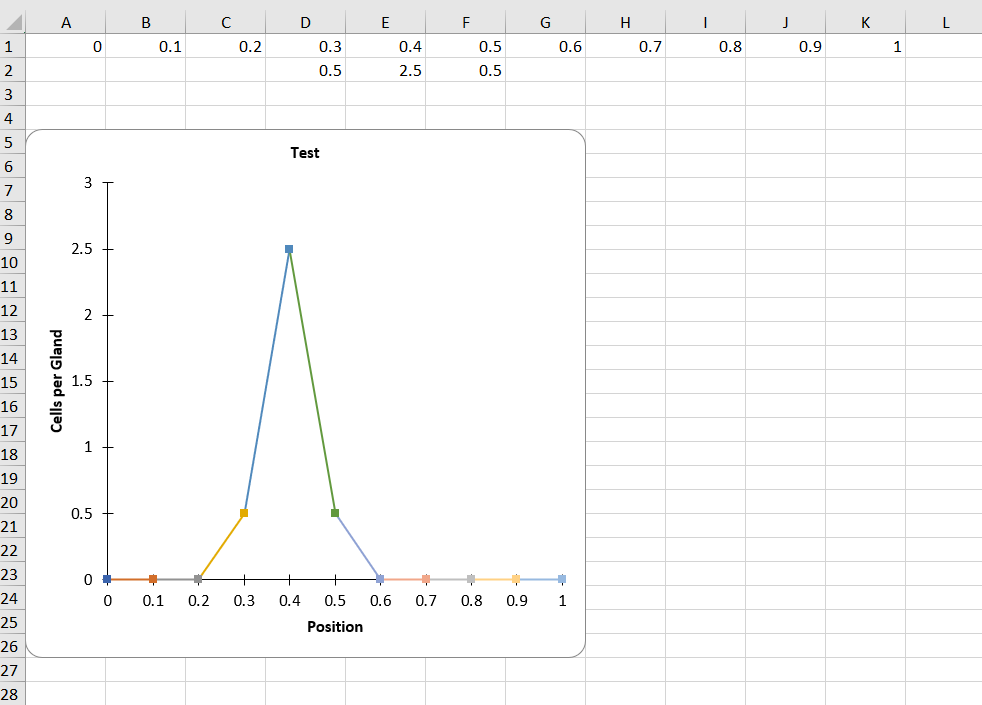
When you launch the plugin you will be immediately asked what you want the bin interval to be. Once an image is run, the normalized distances to user selected points will range from 0 (directly on the base line) or 1.0 (directly on the top line). Example (assuming you choose a bin interval of 0.1): distances will be charted as such: 0.1, 0.2,0.3 … 1.0. After this, you will be asked to place points through a .csv. The format for this CSV is simply a two column csv with one column being x and the other being y.
Batch Processing
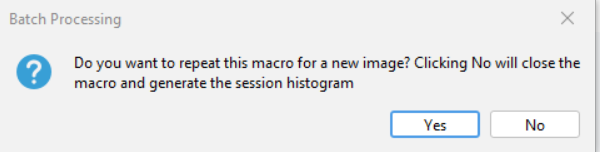
You will be prompted if you want to repeat with another image. Every image will output both excel files detailed in data output, but keep in mind that while the xls file that has the image name will be specific to the image it ran under, the histogram will account for ALL IMAGES RUN IN THAT SESSION. MEANING: if you realize you ran the wrong type of image or you annotated it poorly, you can get the histogram results from the previous image and essentially have a clean restart point.
Data Output
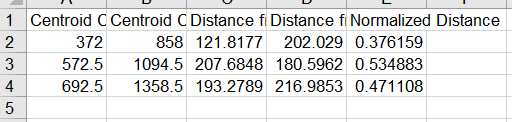
For saving images you will be prompted to select a folder, I would highly reccomend that you save everything in the same folder as the image, as all outputs are coded to start with the same information as the image. In my practice this has been the most sensible way to format everything. The image saving format is as a .tiff, but all inputs accepted by ImageJ are accepted in this plugin. There will also be two excel sheets as the output. One of them is all the information in the image (centroid coordinates, distances from the base to the centroid, distances from the top to the centroid and then the normalized distance). The other one the averaged out one that uses the normalized distances and the bin intervals that the user specified earlier.
Common Useful Commands:
ctrl + a: Undoes your current selection, excellent way to let you redo anything that pops up
Questions(?)
If you have any questions or issues, please contact me with concerns or create an issue within github itself. Although this is a plugin affiliated with the Weis Lab at Wake Forest University I am the sole developer so contacting them with any issues you have with this will be fruitless but I would be happy to help with anything.